If you watch any team oriented sport, you will hear the phrase “Defense wins championships,”. However, I believe that in the NHL your goalie’s performance is even more enhanced compared to the regular season. If you watch the NHL playoffs most will agree there isn’t many other postseasons like it. The energy is unmatched. My belief is that if your goalie becomes “hot” in the playoffs they will win more games.
Let’s take a look at some stats.
library(tidyverse)## ── Attaching packages ─────────────────────────────────────── tidyverse 1.3.0 ──## ✓ ggplot2 3.3.3 ✓ purrr 0.3.4
## ✓ tibble 3.0.3 ✓ dplyr 1.0.2
## ✓ tidyr 1.1.2 ✓ stringr 1.4.0
## ✓ readr 1.4.0 ✓ forcats 0.5.0## ── Conflicts ────────────────────────────────────────── tidyverse_conflicts() ──
## x dplyr::filter() masks stats::filter()
## x dplyr::lag() masks stats::lag()library(ggrepel)regseason1920 <- read.csv("regseason20192020.csv")
regseason1819 <- read.csv("regseason20182019.csv")
regseason1718 <- read.csv("regseason20172018.csv")
regseason1617 <- read.csv("regseason20162017.csv")
regseason1516 <- read.csv("regseason20152016.csv")
regseason1415 <- read.csv("regseason20142015.csv")
regseason1314 <- read.csv("regseason20132014.csv")
regseason1213 <- read.csv("regseason20122013.csv")
regseason1112 <- read.csv("regseason20112012.csv")
regseason1011 <- read.csv("regseason20102011.csv")regseason1011 <- regseason1011 %>% mutate(Year = 2011)
regseason1112 <- regseason1112 %>% mutate(Year = 2012)
regseason1213 <- regseason1213 %>% mutate(Year = 2013)
regseason1314 <- regseason1314 %>% mutate(Year = 2014)
regseason1415 <- regseason1415 %>% mutate(Year = 2015)
regseason1516 <- regseason1516 %>% mutate(Year = 2016)
regseason1617 <- regseason1617 %>% mutate(Year = 2017)
regseason1718 <- regseason1718 %>% mutate(Year = 2018)
regseason1819 <- regseason1819 %>% mutate(Year = 2019)
regseason1920 <- regseason1920 %>% mutate(Year = 2020)regseasons <- bind_rows(regseason1011, regseason1112, regseason1213, regseason1314, regseason1415, regseason1516, regseason1617, regseason1718, regseason1819, regseason1920)regseasons <- regseasons %>% filter(GP > 30)The first data set I will be looking at is every goalie from the 2010-2011 season to the 2019-2020 season of last year from Sports Reference’s NHL site. I grouped them into one large data set and then filtered it to only show goalies who played in more than 30 games, indicating they were regular time starters for their team.
ploffs1920 <- read.csv("ploffs20192020.csv")
ploffs1819 <- read.csv("ploffs20182019.csv")
ploffs1718 <- read.csv("ploffs20172018.csv")
ploffs1617 <- read.csv("ploffs20162017.csv")
ploffs1516 <- read.csv("ploffs20152016.csv")
ploffs1415 <- read.csv("ploffs20142015.csv")
ploffs1314 <- read.csv("ploffs20132014.csv")
ploffs1213 <- read.csv("ploffs20122013.csv")
ploffs1112 <- read.csv("ploffs20112012.csv")
ploffs1011 <- read.csv("ploffs20102011.csv")
ploffs1011 <- ploffs1011 %>% mutate(Year = 2011)
ploffs1112 <- ploffs1112 %>% mutate(Year = 2012)
ploffs1213 <- ploffs1213 %>% mutate(Year = 2013)
ploffs1314 <- ploffs1314 %>% mutate(Year = 2014)
ploffs1415 <- ploffs1415 %>% mutate(Year = 2015)
ploffs1516 <- ploffs1516 %>% mutate(Year = 2016)
ploffs1617 <- ploffs1617 %>% mutate(Year = 2017)
ploffs1718 <- ploffs1718 %>% mutate(Year = 2018)
ploffs1819 <- ploffs1819 %>% mutate(Year= 2019)
ploffs1920 <- ploffs1920 %>% mutate(Year = 2020)playoffs <- bind_rows(ploffs1011, ploffs1112, ploffs1213, ploffs1314, ploffs1415, ploffs1516, ploffs1617, ploffs1718, ploffs1819, ploffs1920) playoffs <- playoffs %>% filter(GP > 10)playoffstuds <- playoffs %>% filter(SV. > .940)So I filtered the original playoff data into a separate block to display the most elite goalies of the playoffs who had a save percentage greater then .940. We will use this later on.
regseasons <- regseasons %>% mutate(Player=gsub("\\\\.*","",Player))
playoffs <- playoffs %>% mutate(Player=gsub("\\\\.*","",Player))
playoffstuds <- playoffstuds %>% mutate(Player=gsub("\\\\.*","",Player))
regseasons <- regseasons %>% mutate(PlayerLabel = paste(Player, Year, sep=" "))
playoffs <- playoffs %>% mutate(PlayerLabel = paste(Player, Year, sep=" "))
playoffstuds <- playoffstuds %>% mutate(PlayerLabel = paste(Player, Year, sep=" "))Next, I did the same thing as the regular season but this time with playoff statistics. This time filtering by goalies who played more than 10 game to indicate that they made it past the first round of the playoffs. We added a “Year” column to every original .csv and then mutated it to display next to the player’s name.
regseasons %>% summarise(avgsv. = mean(SV.))## avgsv.
## 1 0.9135283playoffs %>% summarise(plavgsv. = mean(SV.))## plavgsv.
## 1 0.9221493ggplot() +
geom_hline(yintercept = 0.9135283, color= "blue") +
geom_hline(yintercept = 0.9221493, color= "red") +
geom_text(aes(x=.3, y=.925, label="Average playoffs save %"), color="red") +
geom_text(aes(x=.3, y=.91, label="Average regular season save %"), color="blue") +
geom_point(
data=regseasons,
aes(x=QS., y=SV.),
color="grey",
alpha=.5) +
geom_point(
data=playoffs,
aes(x=QS., y=SV.),
color="green") +
geom_point(
data=playoffstuds,
aes(x=QS., y=SV.),
color="maroon") +
geom_text_repel(
data=playoffstuds,
aes(x=QS., y=SV., label=PlayerLabel)) +
labs(x="Quality Starts %", y="Save %", title="Playoff Goalie performance vs Regular Season", subtitle="Goalies in the playoffs, on average, perform better.", caption="Source: Sports-Reference.com | By Alex Kopf") +
theme_minimal() +
theme(
plot.title = element_text(size = 16, face = "bold"),
axis.title = element_text(size = 8),
axis.text = element_text(size = 7),
axis.ticks = element_blank(),
panel.grid.minor = element_blank(),
panel.grid.major.x = element_blank()
) 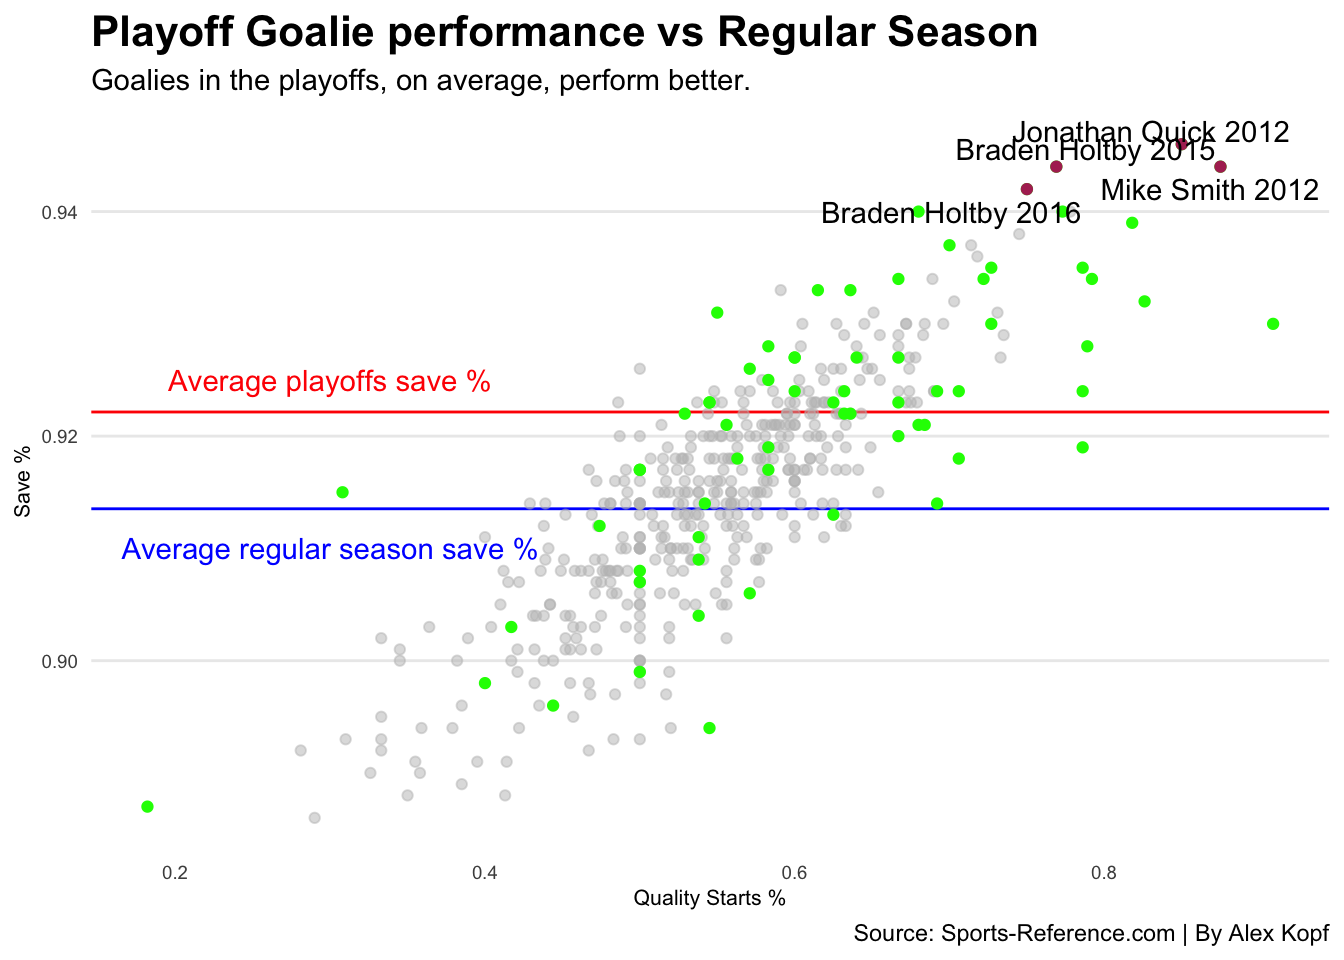 From the scatterplot above, you can see a majority of the playoff goalies, marked in green, are above the average save percentage line during the regular season the last 10 years. No surprise, the playoffs average save percentage is also a whole 100th of a point higher which means a lot in terms of save percentage.
Now that we looked at save percentage, in both the regular season and the playoffs, I’d like to take a look closer at the x-axis in my previous plot. A quality start is defined as when a goaltender achieves at least the mean save percentage during that season. There is an additional criteria for low shooting games: if a goalie faces 20 or fewer shots, he only needs to get an 88.5% save percentage. I’d like to use a waffle chart to display this.
library(waffle)regseasons %>% summarise(sum(GS))## sum(GS)
## 1 18796regseasons %>% summarise(sum(QS))## sum(QS)
## 1 10250playoffs %>% summarise(sum(GS))## sum(GS)
## 1 1117playoffs %>% summarise(sum(QS))## sum(QS)
## 1 704I summed up the total starts and quality starts for both the regular season data and playoffs. To determine the total number of quality and non-quality starts.
regularstarts <- c("Non-Quality Starts"=8546, "Quality Starts"=10250)
playoffstarts <- c("Non-Quality Starts"=413, "Quality Starts"=704)
regularstarts <- c("Non-Quality Starts"=8546, "Quality Starts"=10250)
playoffstarts <- c("Non-Quality Starts"=413, "Quality Starts"=704, 17679)I created our data to use for my waffle chart, adding additional starts to the playoffs so I can have the same scale when comparing the two data frames.
iron(
 waffle(
   regularstarts/50,
   rows = 10,
   colors = c("black", "red", "white")) +
   labs(title="Regular season starts vs the Playoffs", subtitle="Dominant Goalies come alive during the playoffs") +
   theme(
    plot.title = element_text(size = 16, face = "bold"),
    axis.title = element_text(size = 10),
    axis.title.y = element_blank()
  ),
 waffle(
   playoffstarts/50,
   rows = 10,
   xlab="1 square = 50 starts",
   colors = c("black", "red", "white")) + labs(caption="Source: Sports-Reference.com | By Alex Kopf")
) 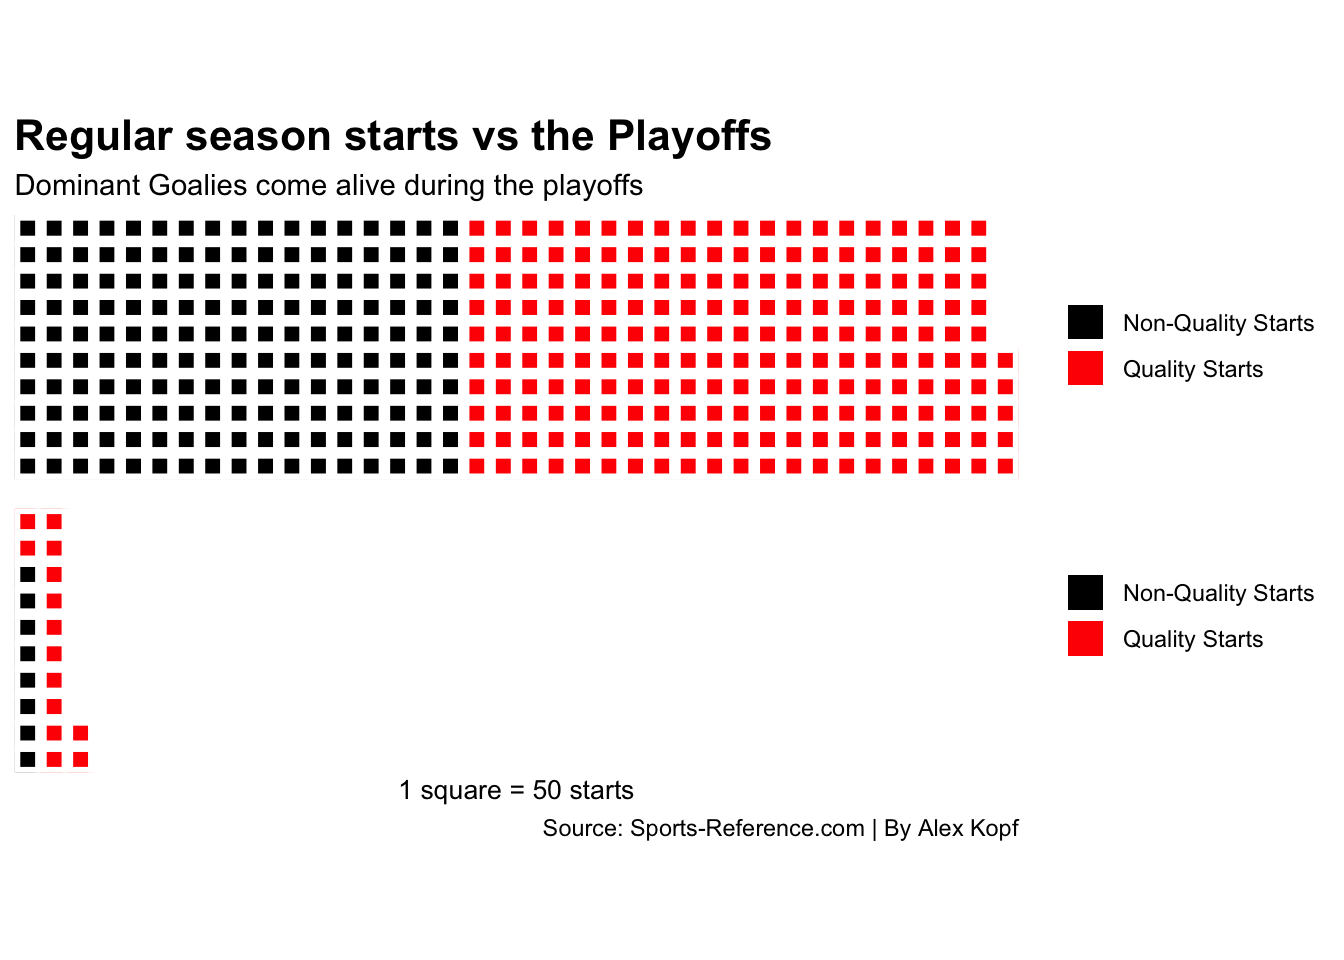
Let’s breakdown the waffle grid above. Though there are many more squares in the regular season, the distribution of quality starts and non-quality starts is pretty close to even, whereas the playoffs is heavily leaned towards more quality start than non-quality, indicating that goaltenders in the playoffs perform at a higher level than the regular season.
Finally, I would like to take a look at the four goalies we filtered out earlier for having above .940 save percentages in the playoffs.
reg12 <- regseason1112 %>% mutate(SeasonType = "Regular")
play12 <- ploffs1112  %>% mutate(SeasonType = "Playoffs")
reg15 <- regseason1415  %>% mutate(SeasonType = "Regular")
play15 <- ploffs1415  %>% mutate(SeasonType = "Playoffs")
reg16 <- regseason1516  %>% mutate(SeasonType = "Regular")
play16 <- ploffs1516  %>% mutate(SeasonType = "Playoffs")
top4 <- bind_rows(reg12, play12, reg15, play15, reg16, play16)top4 <- top4 %>% mutate(Player=gsub("\\\\.*","",Player))
top4 <- top4 %>% mutate(PlayerLabel = paste(Player, Year, sep=" "))top4 <- top4 %>% filter(PlayerLabel =="Jonathan Quick 2012" | PlayerLabel == "Mike Smith 2012" | PlayerLabel == "Braden Holtby 2015" | PlayerLabel == "Braden Holtby 2016") In the lines above, I mutated the data for the years the 4 goalies produced the >.940 save percentage to display regular and playoffs and then filtered the data to show only those 4 goalies performances in the regular and postseason of that year.
ggplot() +
  geom_bar(data=top4, aes(x=SeasonType, weight=`SV.`, fill = SeasonType)) +
labs(
    title="Top 4 Playoff goalies by Save %",
    x="Player",
    y="Save %"
)  +
  facet_wrap(~PlayerLabel, scales="free_y") +
  coord_cartesian(ylim=c(.9, .99)) + labs(x="Player", y="Save %", title="Top 4 Playoff Goalies performance vs Regular Season", subtitle="These goalies though they had good regular season, were amazing in the playoffs.", caption="Source: Sports-Reference.com | By Alex Kopf")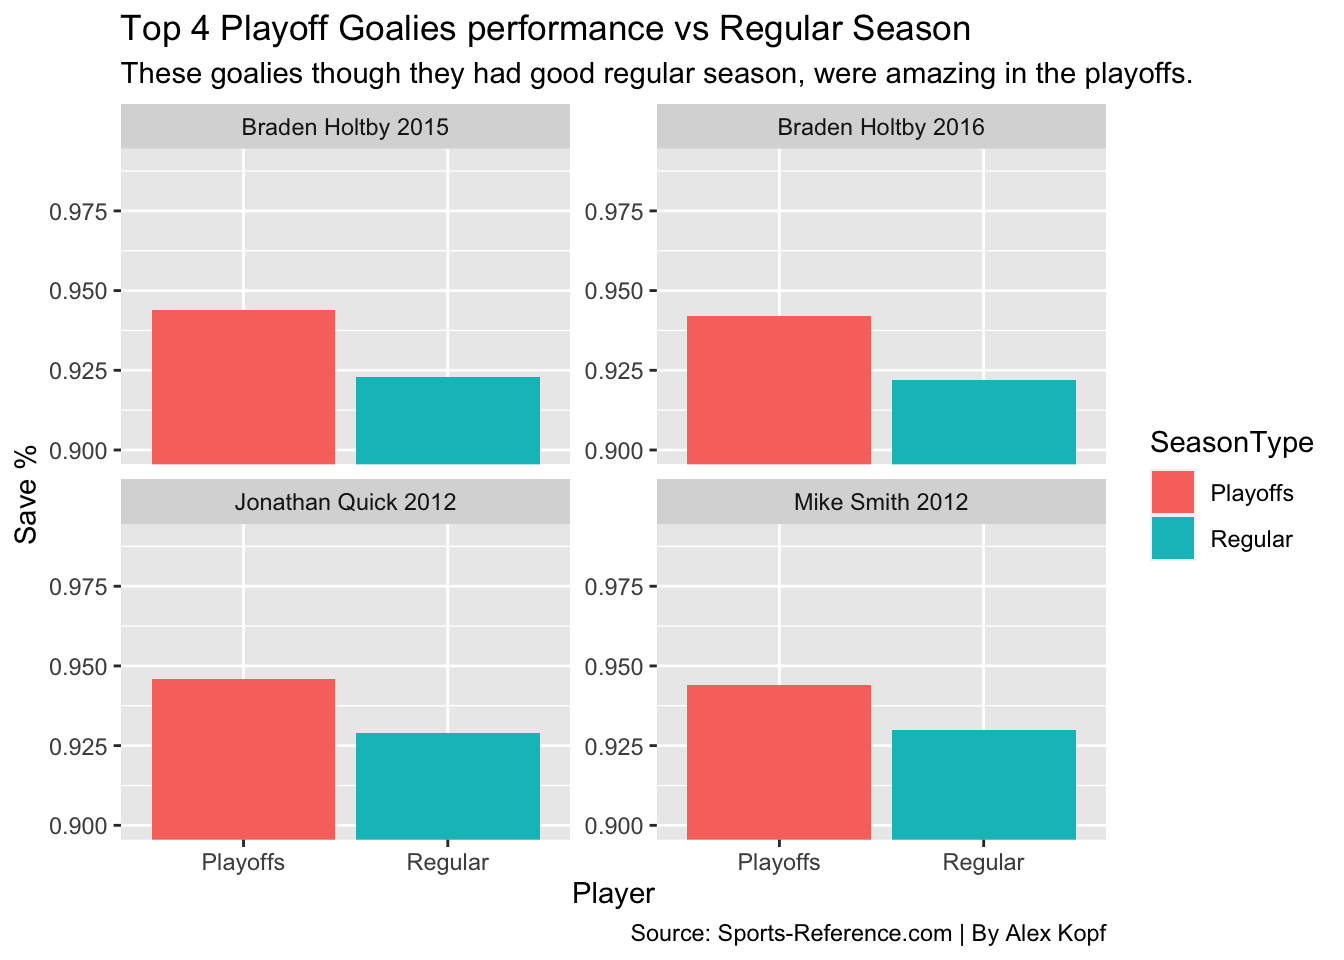
As the facet wrap of bar charts shows above, these four goalies, though they played great in the regular season, played even better in the playoffs. Every goalie improved his save percentage by at least .10 which is insane when referring to save percentage.
Based off the data collected and three visuals produced, I think it is fair to assume that goaltender performances in the playoffs are amplified when compared to the regular season.