As a hockey fan my entire life, and sharing the same first name, I have always been a fan of Russian superstar Alexander Ovechkin of the Washington Capitals. As he continues his career, Ovechkin is nearing Gretzky’s goal record more and more. Even if he doesn’t pass it, could he be considered right now as the best pure goal scorer of all time? Lets look at some data
library(tidyverse)
library(ggrepel)
library(rvest)
Ovi <- read_csv("OviandGreats.csv")Ovi <- Ovi %>%
mutate(Player=gsub("\\\\.*","",Player))Ovechkin <- Ovi %>%
filter(Player == "Alex Ovechkin")
Gretzky <- Ovi %>%
filter(Player == "Wayne Gretzky*")In the data set I acquired, we have the Top 11 goal scorers of all time, since Ovechkin is in the Top 10. I also included the player he is most compared to, Sidney Crosby, and argued the best player right now who is Connor McDavid.
Ovi %>% summarise(avgspct = mean(`S%`))## # A tibble: 1 x 1
## avgspct
## <dbl>
## 1 14.7Ovi %>% summarise(avgG = mean(G))## # A tibble: 1 x 1
## avgG
## <dbl>
## 1 679.I want to see where Ovechkin stood related to his peers and their shooting percentage plus goals average among themselves.
ggplot() +
geom_point(
data=Ovi,
aes(x=G, y=`S%`, size= S),
color="grey",
alpha=.5) +
geom_point(
data=Ovechkin,
aes(x=G, y=`S%`, size= S),
color="red") +
geom_point(
data=Gretzky,
aes(x=G, y=`S%`, size= S),
color="blue") +
geom_text_repel(
data=Ovi,
aes(x=G, y=`S%`, label=Player)) +
geom_hline(yintercept = 14.66154) +
geom_vline(xintercept = 678.8462) +
labs(x="Goal Count", y="Shooting %", title="Career Goals and Shooting Percentage", subtitle="Ovechkin takes the most shots by far", caption="Source: Sports-Reference.com | By Alex Kopf") +
theme_minimal() +
theme(
plot.title = element_text(size = 16, face = "bold"),
axis.title = element_text(size = 8),
axis.text = element_text(size = 7),
axis.ticks = element_blank(),
panel.grid.minor = element_blank(),
panel.grid.major.x = element_blank()
) 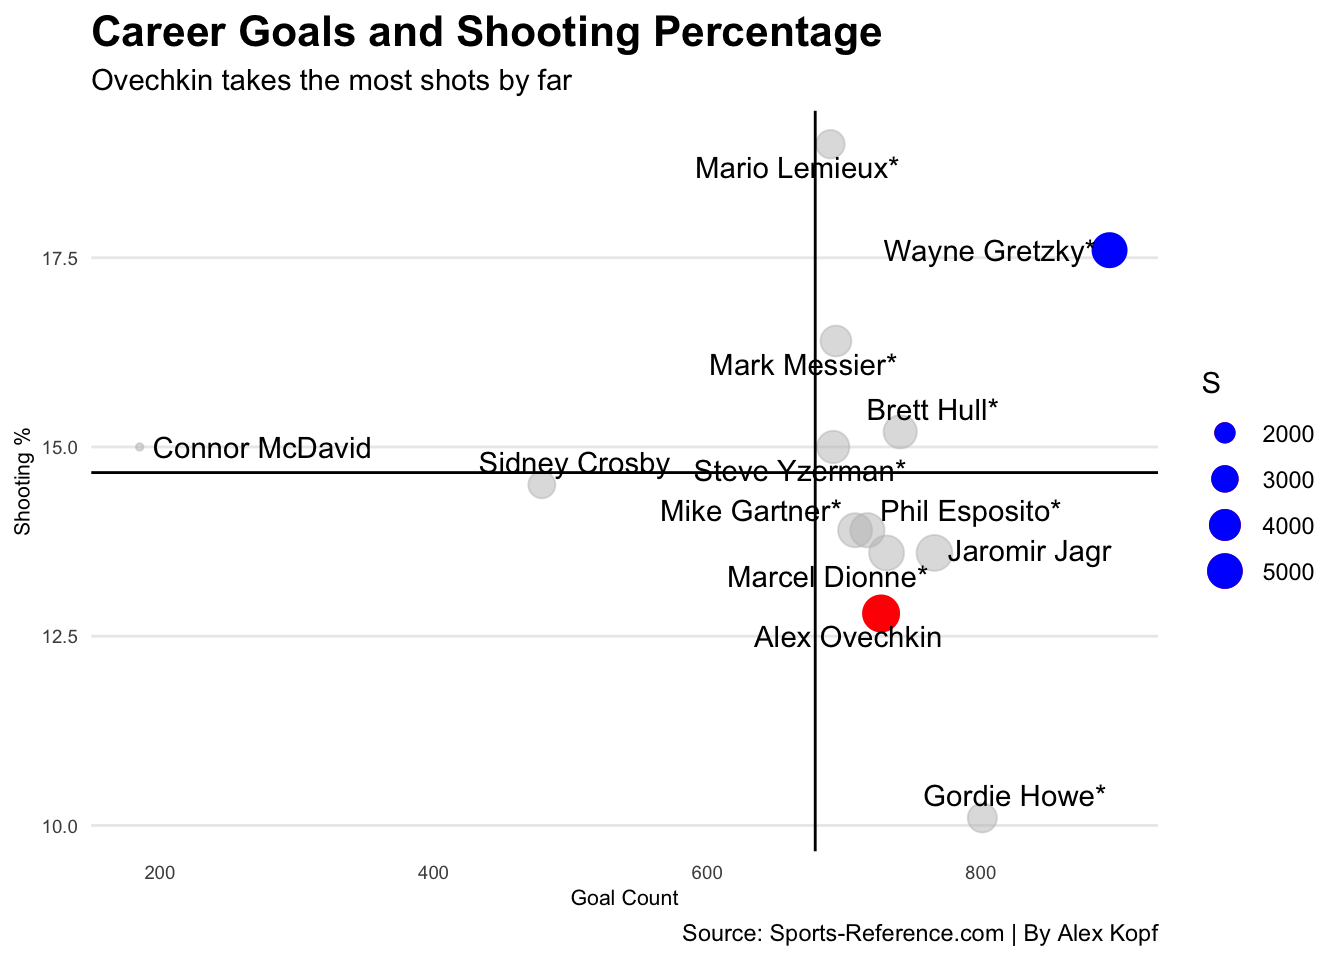 As we can see above, Ovechkin is dead last among his peers in the top 10 goal scorers when it comes to shooting percentage. However, he also takes the most shots out of anyone in the data set. Now let’s look at Ovechkin’s strongest suit, the powerplay.
goals <- Ovi %>%
 group_by(Player) %>%
   summarise(
    CareerPowerplay = sum(PP),
    CareerEven = sum(EV),
    CareerShort = sum(SH))
goals %>%
pivot_longer(
cols=starts_with("Career"),
names_to="Type",
values_to="Goals") -> cargoalsggplot(cargoals, aes(x=Player, weight=Goals, fill=Type)) +
geom_bar() +
coord_flip() +
labs(x="Player", y="Career Goal Count", title="Ovechkin Owns the Man Advantage", subtitle="You want Ovechkin as your extra man", caption="Source: Sports-Reference.com | By Alex Kopf") +
theme_minimal() +
theme(
plot.title = element_text(size = 16, face = "bold"),
axis.title = element_text(size = 8),
axis.text = element_text(size = 7),
axis.ticks = element_blank(),
panel.grid.minor = element_blank(),
panel.grid.major.x = element_blank()
) 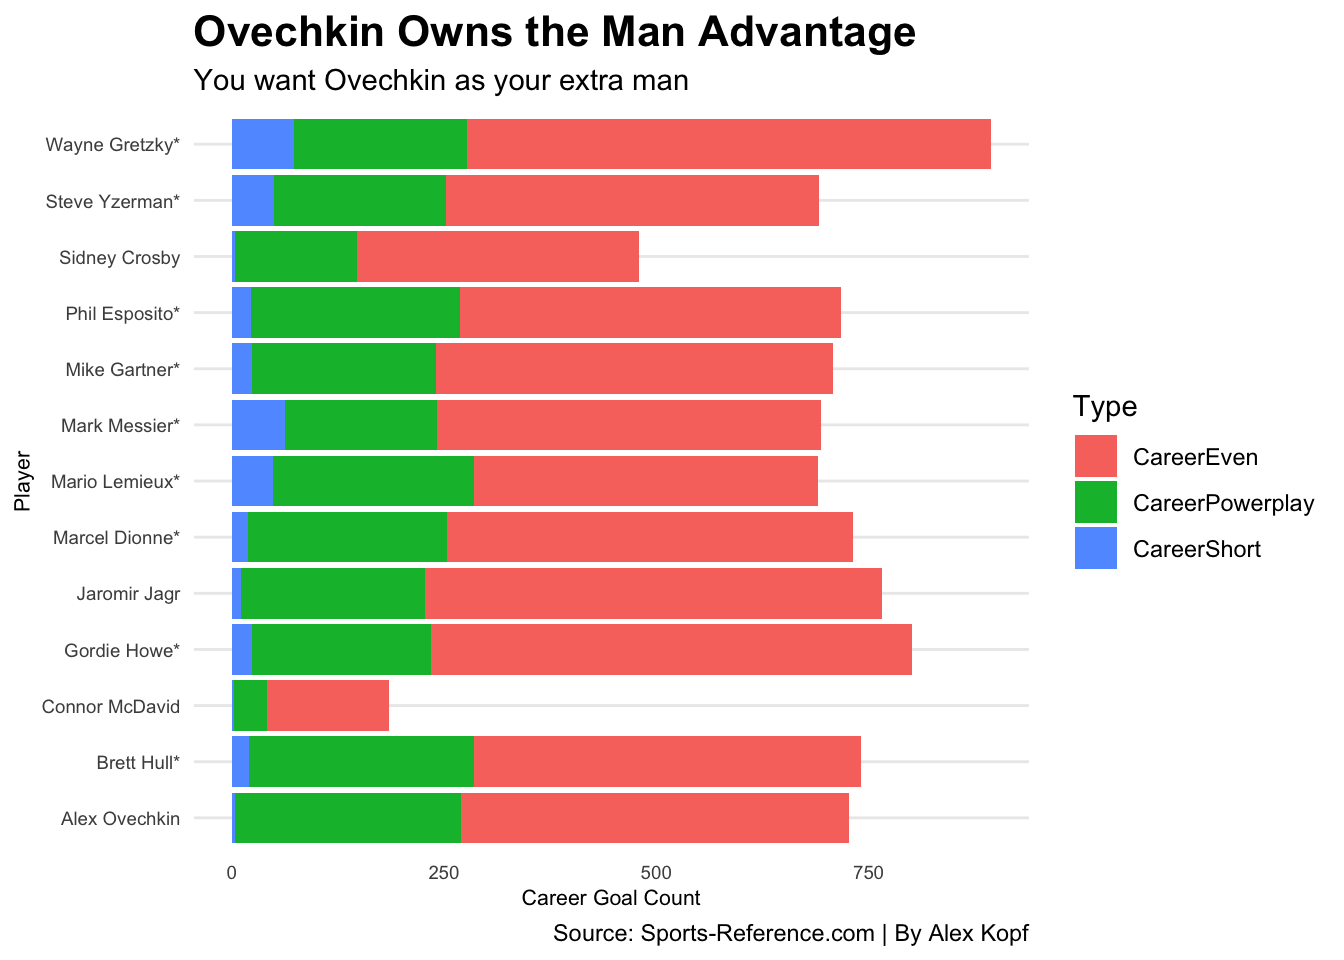
As expected, Ovechkin has the most powerplay goals among the rest, so I would say it is safe to conclude if not the best scorer, Ovechkin is the best scorer with a man advantage. Why does this matter? If you’re pulling your goalie, you want Ovechkin as your extra man. Finally, I would like to compare the two main players we want to observe side by side. Ovechkin, and Gretzky.
CareerOvi <- read_csv("ovechkin.csv") %>%
  mutate(Name = "Ovechkin")
CareerGretzky <- read_csv("gretzky.csv") %>%
  mutate(Name = "Gretzky")
POI <- bind_rows(CareerGretzky, CareerOvi)cumPOI <- POI %>%
group_by(Name) %>%
mutate(CumGoals = cumsum(G)) GreatEight <- cumPOI %>%
filter(Name == "Ovechkin")
GreatOne <- cumPOI %>%
filter(Name == "Gretzky")ggplot() +
geom_step(data=cumPOI, aes(x=Season, y=CumGoals, group=Name), color="light grey") +
geom_step(data=GreatEight, aes(x=Season, y=CumGoals, group=Name), color="navy") +
geom_step(data=GreatOne, aes(x=Season, y=CumGoals, group=Name), color="orange") +
geom_hline(yintercept = 678.8462) +
labs(x="Season", y="Goals", title="Gretzky vs Ovechkin", subtitle="Will Ovechkin Catch The Great One?", caption="Source: Sports-Reference.com | By Alex Kopf") +
theme_minimal() +
theme(
plot.title = element_text(size = 16, face = "bold"),
axis.title = element_text(size = 8),
axis.text = element_text(size = 7),
axis.ticks = element_blank(),
panel.grid.minor = element_blank(),
panel.grid.major.x = element_blank()
) + scale_x_discrete(breaks=c("1979-80","1984-85","1989-90","1994-95","1999-00","2004-05","2009-10","2014-15","2019-20"))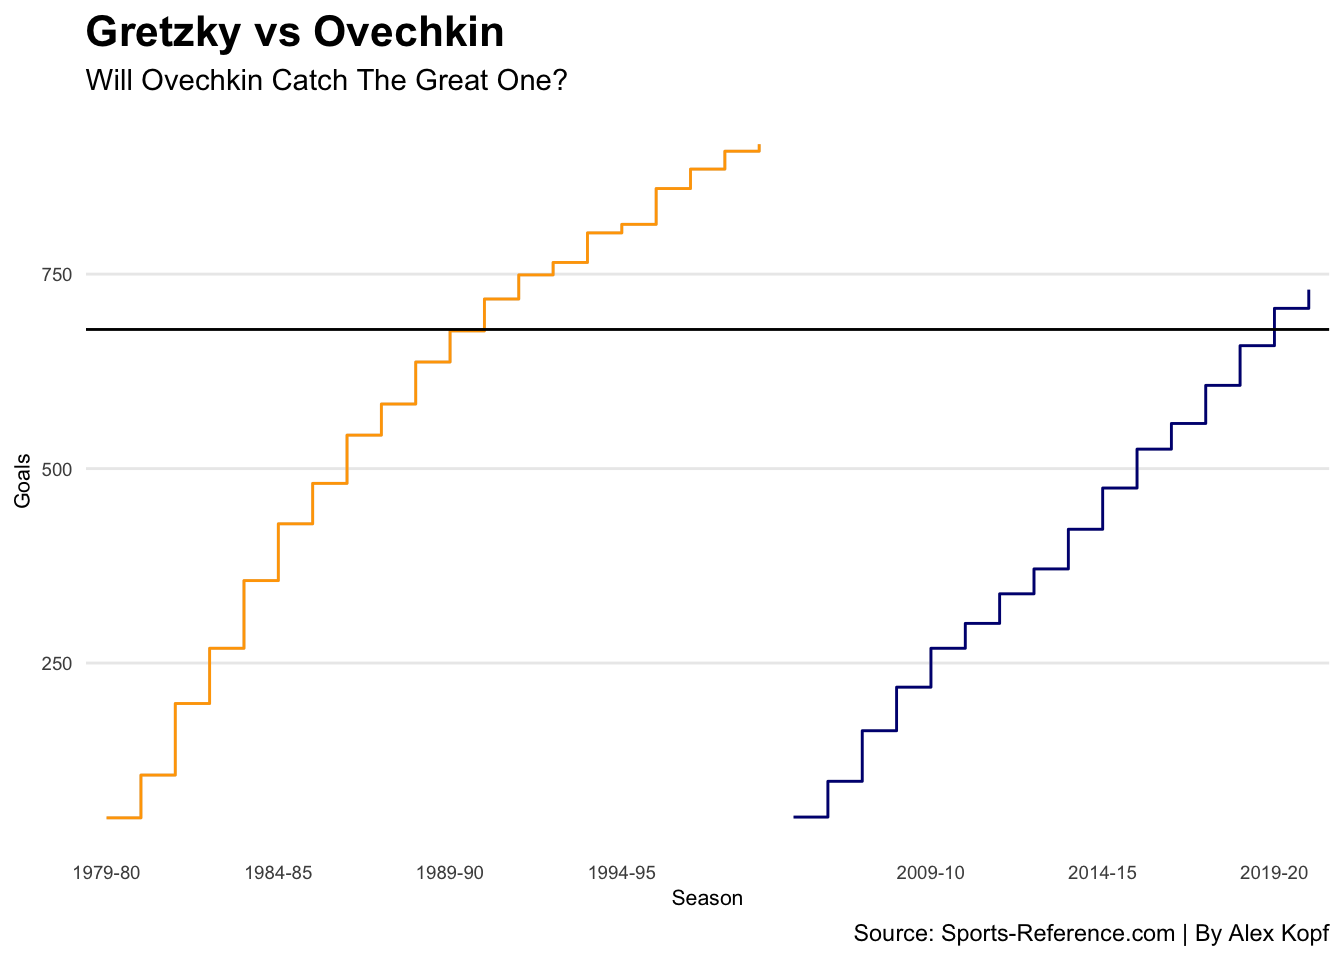 As shown above, Ovechkin hasn’t climbed as fast as Gretzky but isn’t too far off depending on how many years he continues to play. Based off our three charts created, we can conclude that as of now, Ovechkin is not the best goal scorer of all time. But there is another stat that surprised me. There is a section that adjusts the stats of players to make them comparable as if they all players the same number of game seasons, faced the same goalies and same scoring ocurred. Here is how it is explained via sports reference. In order to do this, divide 82 by the number of scheduled games per team. In 1952-53 the NHL played a 70-game schedule, so the schedule adjustment is 82 / 70 = 1.17.
The roster size adjustment is computed by dividing the maximum roster size for the season in question by 18. Teams were allowed to carry a maximum of 16 skaters at home and 15 skaters on the road during the 1952-53 season, so the roster size adjustment is 15.5 / 18 = 0.86.
Next calculate the era adjustment, which we will do by dividing 6 by the league average goals per game without the player in question. In 1952-53 a total of 1006 goals were scored in 210 games. Without Howe this works out to (1006 - 49) / 210 = 4.56 goals per game, so our era adjustment is 6 / 4.56 = 1.32.
Finally, we put everything together. Take the player’s actual goals and multiply by the adjustments we computed above.
So I would like to look at the same scatterplot from above but with adjusted goals.
Ovi <- Ovi %>%
  rename(AdjG = G_1)
Ovechkin <- Ovechkin %>%
rename(AdjG =G_1)
Gretzky <- Gretzky %>%
rename(AdjG = G_1)ggplot() +
geom_point(
data=Ovi,
aes(x=AdjG, y=`S%`, size= S),
color="grey",
alpha=.5) +
geom_point(
data=Ovechkin,
aes(x=AdjG, y=`S%`, size= S),
color="red") +
geom_point(
data=Gretzky,
aes(x=AdjG, y=`S%`, size= S),
color="blue") +
geom_text_repel(
data=Ovi,
aes(x=AdjG, y=`S%`, label=Player)) +
geom_hline(yintercept = 14.66154) +
geom_vline(xintercept = 678.8462) +
labs(x="Adjusted Goal Count", y="Shooting %", title="Adjusted Goals makes a difference", subtitle="Ovechkin takes the lead over Gretzky when adjuested goals are put in play", caption="Source: Sports-Reference.com | By Alex Kopf") +
theme_minimal() +
theme(
plot.title = element_text(size = 16, face = "bold"),
axis.title = element_text(size = 8),
axis.text = element_text(size = 7),
axis.ticks = element_blank(),
panel.grid.minor = element_blank(),
panel.grid.major.x = element_blank()
) 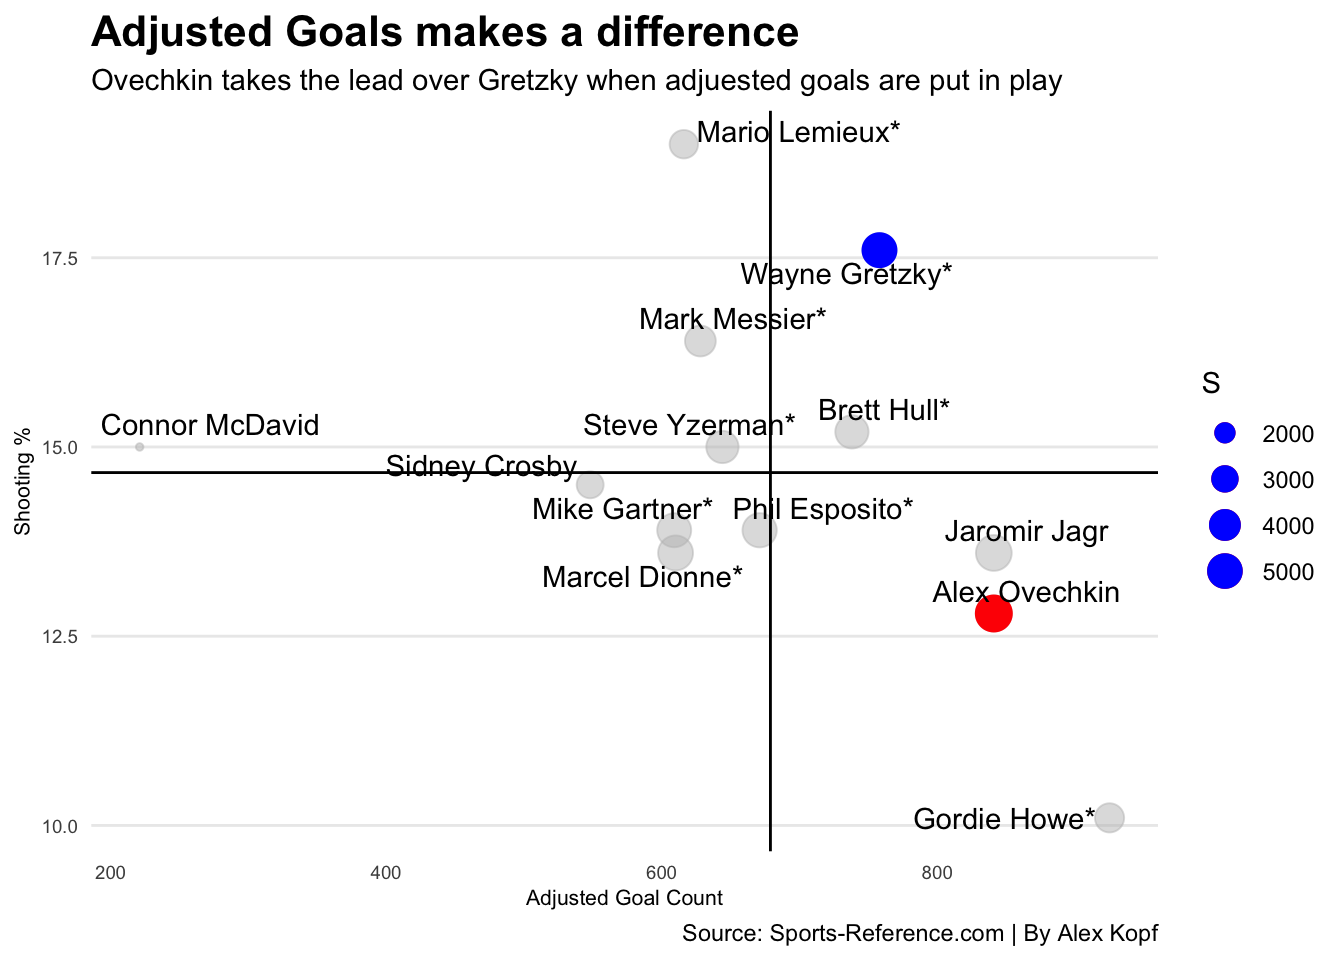
As we can see above, when adjusted goals is used instead, Ovechkin scored almost 100 more goals than Gretzky already. So does this mean Gretzky wouldn’t have scored as much in today’s League? Or would Ovechkin have scored more back then? Either way Ovechkin isn’t the goal king yet but he could be before he retires.